Diamond price per carat in 2026: how the curve actually steps
What 1ct, 1.5ct, and 2ct round brilliants actually cost per carat in April 2026 - the bucket-by-bucket curve, with the steps where price tiers change.
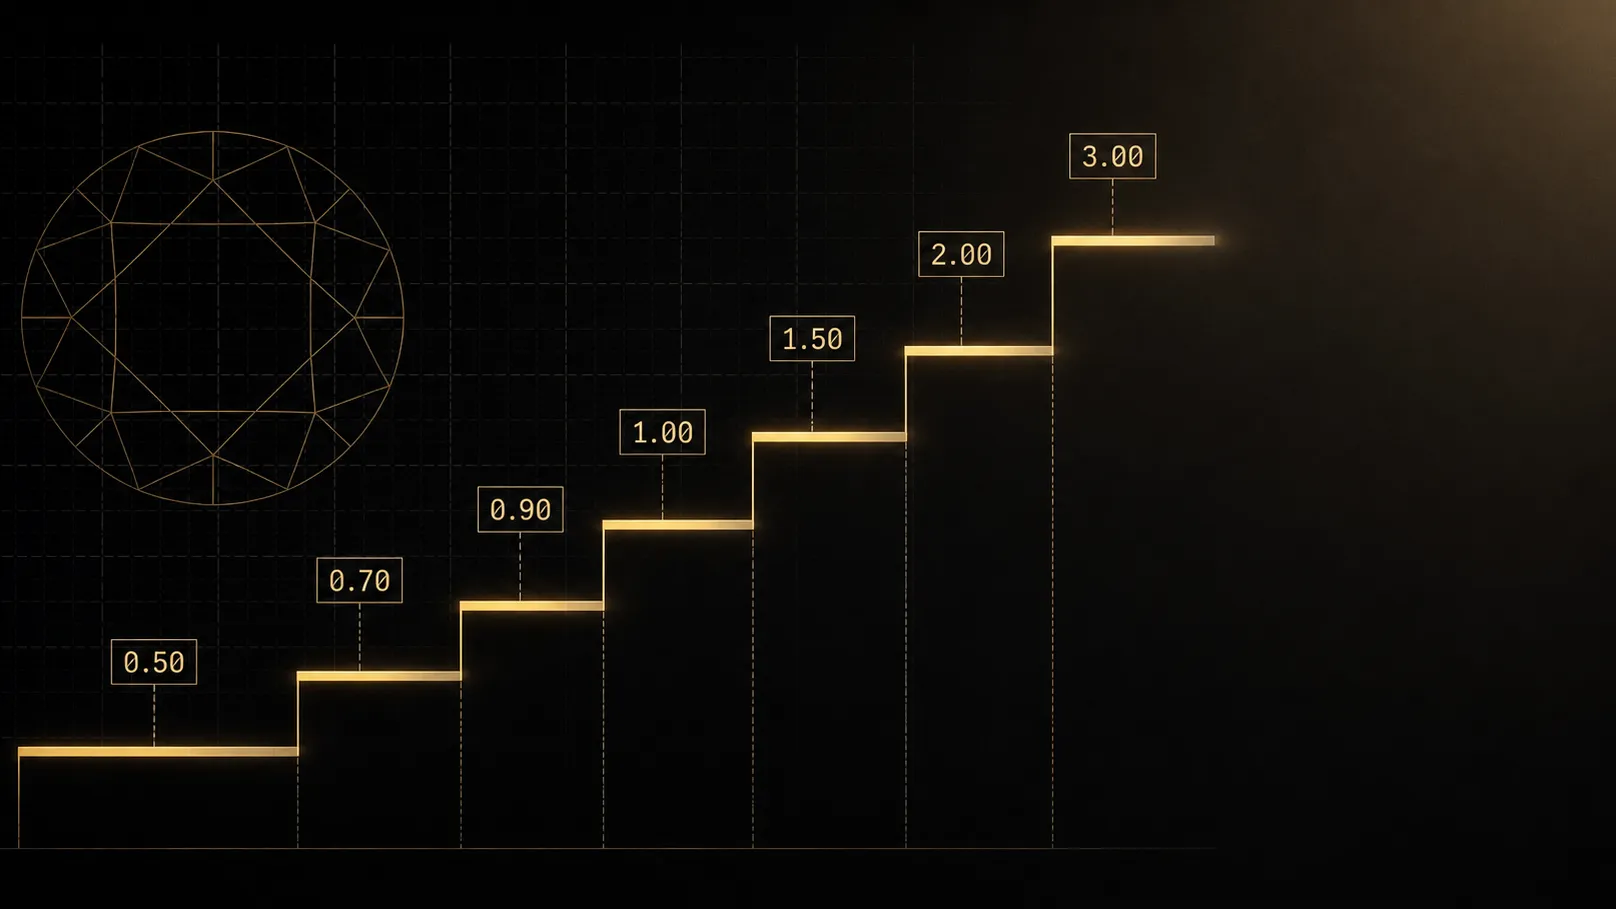
How much does a 1.00ct G VS1 EX round brilliant cost per carat in 2026, and how much does the figure step when the same stone crosses into the next weight bucket? The curve through April 2026 is closer to a staircase than a smooth line, with risers at different heights than the price sheets that were sourcing last quarter's quotes. Below is what the steps actually look like, bucket by bucket, against fixed colour and clarity.
April 2026 — round, G VS1 EX, GIA
What is a carat premium?
A carat premium is the increase in per-carat price as a diamond crosses a weight threshold - typically a round-number bucket boundary like 0.50ct, 1.00ct, 1.50ct, or 2.00ct. Two stones that differ by a few hundredths of a carat can sit in different price tiers when the lighter one is just below a threshold and the heavier one is just above. The premium reflects buyer-pool composition at each weight, not any meaningful change in the stone itself.
This post fixes the comparable to round brilliant, G VS1, Excellent cut, on GIA paper, snapshot taken late April 2026. Holding the other parameters still is the only way to read the carat curve cleanly - letting colour or clarity drift across the buckets blends two effects into one number that describes neither.
Diamond price per carat by weight bucket - April 2026
Avg price per carat by weight bucket
Round brilliant, G VS1, Excellent cut, GIA — April 2026
The chart traces avg price per carat across the standard bridal-to-investment weight ladder. The line is not smooth - it climbs in uneven steps, with the largest riser sitting at the 1.00ct threshold and a second prominent jump at 2.00ct. Between those two anchors the slope is gentler but never flat. Each step corresponds to a change in who is buying that band: the buyer pool at 0.70ct is not the buyer pool at 1.50ct, even when the stones are otherwise identical.
Three features stand out in the 2026 reading. First, the 0.90–0.99ct band sits noticeably below where extrapolation would put it - buyers in that band know they are paying for "almost a carat," not a carat. Second, the 1.00–1.49ct step is the largest single jump on the curve and has held its height through eighteen months of lab-grown pressure on adjacent bands. Third, the 2.00ct step has widened against 2024 readings - the round-number positioning has stiffened, not softened.
| Carat bucket | Avg €/ct | Per-carat step from prev | Absolute € gap from prev |
|---|---|---|---|
| 0.30–0.49 | €1,818 | — | — |
| 0.50–0.69 | €1,917 | 5.4% | €354 |
| 0.70–0.89 | €2,765 | 44.3% | €1,019 |
| 0.90–0.99 | €3,693 | 33.6% | €1,286 |
| 1.00–1.49 | €4,979 | 34.8% | €2,025 |
| 1.50–1.99 | €7,981 | 60.3% | €7,558 |
| 2.00–2.99 | €10,220 | 28.1% | €10,412 |
| 3.00+ | €14,009 | 37.1% | €30,820 |
Read the table two ways. The per-carat step shows what the comp set is paying for the next band on a normalised basis - the figure to use when calibrating a quote against the bucket above or below. The absolute euro gap is what a sourcing manager feels at the invoice, because the per-carat figure compounds with the bucket weight itself. A 0.95ct and a 1.05ct of the same colour and clarity can sit in the same row of a casual spreadsheet and trade 25–32% apart in absolute euro terms.
Conflating the two is one of the cleanest ways to misquote near a threshold. A 18% per-carat step sounds incremental; the 28% absolute gap on the same pair of stones does not. When the trade press summarises "the 1ct premium is about 20%," it is collapsing both figures into one - useful for headlines, dangerous for quotes.
Why the curve isn't smooth: thresholds and buyer pools
The standard physics observation is that diameter scales with the cube root of weight, so a 1% weight change produces only a 0.3% diameter change. A 0.99ct is barely distinguishable from a 1.00ct face-up - well under a tenth of a millimetre at the girdle. The price curve does not care about that physics. It cares about who is buying.
On the demand side, the bridal market anchors retail to round-number carats. A jeweller's window quotes "from 1.00ct" because that is the figure shoppers search for. The 0.90–0.99 band trades into a buyer pool that knows it is paying below the line. Investment-tier purchasing concentrates above 2.00ct, which is why that boundary anchors a second visible step. On the supply side, rough yield economics push cutters toward 1.00ct as a target weight whenever the rough plans either way - the price premium more than compensates for a half-step drop in symmetry or polish grade.
The threshold-by-threshold mechanics - including why 0.99ct stones are usually polishing residue rather than first-choice cuts - are the subject of The 0.99 vs 1.00ct jump: why magic carat sizes still print money. For the underlying weight-to-diameter math, Carat covers the geometry.
Where the 2026 curve breaks from the textbook
Two readings on the curve pull away from the standard pattern. The first is the 2.00ct step. Last year's price sheets sized this jump at roughly 10% per carat above the 1.50–1.99ct band; the 2026 reading puts it closer to 15%, and the spread inside the 2.00–2.99ct bucket has tightened. Investment-tier buyers sitting out the lab-grown compression in lower bands have anchored harder on 2.00ct+ natural as the uncontested zone, and the demand pull at that boundary has stiffened the price step.
The second divergence is at the lower end. The 0.30 → 0.50 step has flattened versus 2023 readings, where the half-carat threshold used to print a clearer 12–15% jump on the per-carat figure. Lab-grown competition has compressed pricing across the smaller-stone band hard enough that the natural-only curve in 0.30–0.69ct reads as gentler than the textbook curve a price sheet from two years ago would describe. The lesson is not that the half-carat line stopped mattering - it is that the band itself has been re-priced as a category, and the threshold premium reads softer because the surrounding buckets moved with it. The compositional mechanics behind that re-pricing are the subject of Lab-grown market share in 2026: the quiet inflection.
Pricing the curve, not the line
Weight ratio: 2.00×· Diameter ratio: 1.26×
Diameters use the industry approximation d ≈ 6.5 × ∛(ct) for a well-proportioned round brilliant. Actual cut geometry can shift face-up diameter by a few tenths of a millimetre.
The visual is the part the spreadsheet does not capture. A 1.00ct is barely larger than a 0.90ct face-up, and a 2.00ct is only ~26% wider in diameter than a 1.00ct. The price curve does not care. It is a buyer-pool curve, not a measuring-stick curve, and the steps live where the buyer pools change, not where the diameter changes.
The Rapaport matrix that wholesale prices have used for decades is built on exactly these buckets, for exactly this reason - averaging across them blends prices that the market does not blend. For the field-level reading of how the listing matrix works, Reading the Rapaport price list covers the structure. For the colour and clarity grades the comp fixes here, Color and Clarity give the reference. April 2026 diamond market report: lab-grown gap widens at the top traces how the 1.00ct and 2.00ct steps held through the month's bridal-band trim while the investment-tier spread widened above them. The curve will keep moving - the bucket-by-bucket reading is what stays usable as it does.