April 2026 diamond market report: lab-grown gap widens at the top
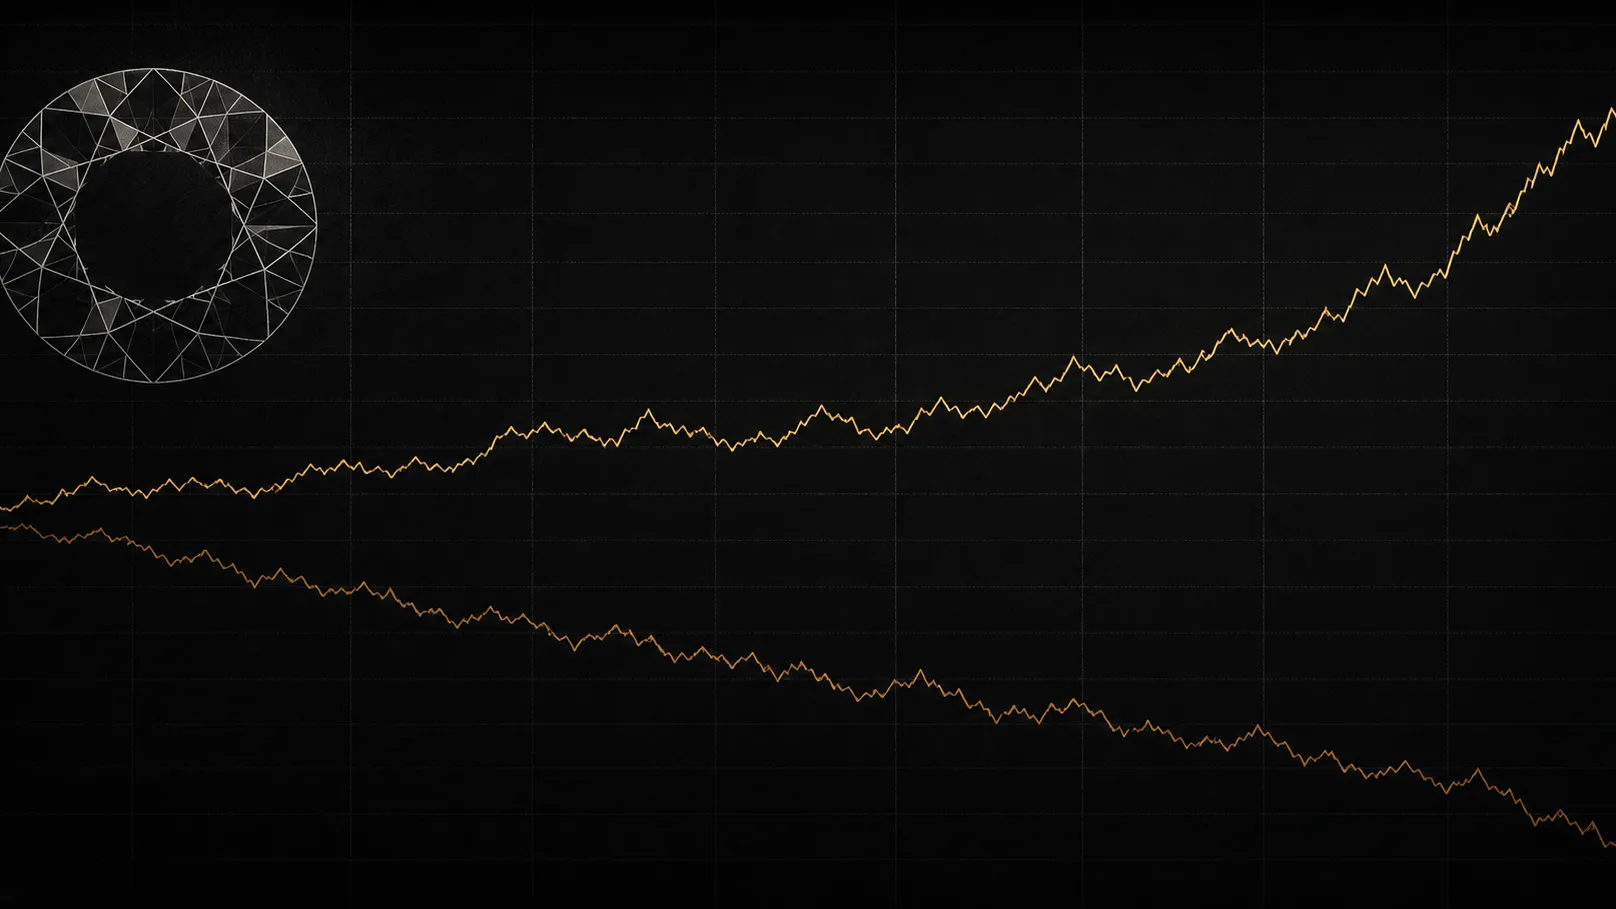
April 2026 diamond prices split by segment: bridal naturals softened against lab-grown, while `2.00ct+ D VVS1+` investment stones held firm.
April 2026 split the natural-diamond market into two regimes that did not move together. Bridal-band naturals - the 1.00–2.00ct G–H VS1–VS2 rows that make up most quotes - kept compressing against the lab-grown comparable, while the investment tier above 2.00ct D VVS1+ widened its premium. A single monthly average describes neither regime cleanly, and the desk that quotes both bands off the same number will mis-price one of them.
April 2026 — natural prices and spread, fixed comp
Methodology: figures are based on Stone Insights platform listings for round brilliant diamonds with comparable grading characteristics on GIA paper. Month-on-month movement compares April 2026 averages against March 2026 for like-for-like weight, colour, and clarity buckets.
Key takeaways
- Bridal
1.00–2.00ct G–H VS1–VS2naturals softened roughly 2–3% month-on-month, with the lab-grown comparable trimming alongside at a slower pace. - The natural-over-lab-grown spread narrowed in bridal sizes but widened above
2.00ct D VVS1+- the 1 carat and 2 carat diamond price trends moved in opposite directions through April. - The
1.00ctand2.00ctthreshold steps held, making segment-level pricing more useful than the monthly average across the full dataset.
April 2026 diamond price movements
The clearest movement in April sat in the bridal 1.00–2.00ct G–H VS1–VS2 band. Natural per-carat prices in that band trimmed roughly 2–3% against March, and the lab-grown comparable trimmed alongside at a slightly slower pace - the spread between the two narrowed by single percentage points, not double. Outside that band the picture inverted. The >2.00ct D VVS1+ rows on GIA paper printed flat to slightly higher on a per-carat basis, and the natural-only spread over lab-grown widened.
The threshold steps held their shape through the month. The 1.00ct riser - the largest single jump on the carat curve and the one Diamond price per carat in 2026: how the curve actually steps traced in detail - did not soften under the bridal-band trim. The 0.95–0.99ct band moved in step with 1.00–1.09ct, so the per-carat step between them stayed roughly where it sat in March. The 2.00ct step actually stiffened, picking up the investment-tier demand pull described below.
| Avg €/ct (Apr) | MoM % | Natural-over-lab spread, MoM | |
|---|---|---|---|
| Round, 1.00–1.09ct, G VS1 EX | €7,950 | −2.4% | −1.6 pp |
| Round, 1.50–1.99ct, G VS1 EX | €9,600 | −1.9% | −1.1 pp |
| Round, 2.00–2.99ct, D VVS1 EX | €21,400 | +0.6% | +0.4 pp |
| Round, 3.00ct+, D IF EX | €38,100 | +1.1% | +0.7 pp |
The table reads as the month in one frame. The two bridal rows trimmed and lost a small slice of their spread over lab-grown; the two investment-tier rows held or rose and widened the spread. A desk that priced both bands off the same monthly average would have under-quoted one and over-quoted the other.
What's driving it
Three drivers shaped the April reading.
The first is the lab-grown floor in the bridal band, which still has not landed. Supply-side production cost on commercial-grade lab-grown round brilliants kept easing through Q1 2026, and the natural prices in directly comparable spec moved with the lab-grown comparable rather than against it. The compositional reading of that pressure - unit share, carat share, and dollar share telling three different stories - sits in The lab-grown gap this month: where natural still holds its premium. April added another month to that pattern; it did not change its direction.
The second is the investment-tier demand pull above 2.00ct D VVS1+. The buyer pool for that segment prices for a 10–20 year resale path on GIA paper, and the lab-grown comparable does not enter the comp set at all. With smaller-stone demand visibly diverting to lab-grown, natural buyers concentrating capital at the top of the ladder stiffened the floor - and the rough supply pipeline for 2.00ct+ D finished goods has not loosened to absorb it. The vertical distance between the natural and lab-grown per-carat curves fans out as weight rises; April widened it at the top end without moving the curve shape elsewhere.
The third is the 1.00ct anchor itself. The threshold step from 0.99 to 1.00ct held its full height through the bridal trim - both sides of the boundary moved together - which is the pattern The 0.99 vs 1.00ct jump: why magic carat sizes still print money flagged as the durable feature of the magic sizes through the lab-grown cycle. The boundary is a buyer-pool boundary, not a measuring-stick boundary, and the buyer pools on each side did not blend in April.
What to watch next
May has three readings worth tracking against the April baseline.
First, whether the bridal-band trim continues at April's pace or stalls. The 2–3% month-on-month move sits inside the noise of single-listing variance on small samples, and one month is not a trend. Two more months in the same direction at the same pace would push the bridal natural-over-lab-grown spread into a regime the platform has not previously printed; a flat May would frame April as a quote-cycle blip.
Second, whether the >2.00ct D widening repeats. April's investment-tier move was small in percentage terms but directionally cleaner than the bridal noise. If the May reading prints flat or positive again on the same rows, the spread between the two regimes - not the monthly average across them - is the headline figure for the quarter.
Third, the half-carat band - 0.30–0.69ct - which has stayed quiet in the platform's reporting through Q1 but is the band most exposed to the next leg of lab-grown supply-cost compression. The 0.30 → 0.50 threshold step has been flattening for three years; an April-to-May read on the same rows will show whether the flattening continues or stabilises.
The May report will close out the first full quarter of monthly readings on the platform and add the first month-over-three-months overlay - the point at which the bridal compression curve becomes long enough to fit a slope to, rather than read one print at a time. Until then, April is the cleanest record of two regimes diverging inside a single market.