Read Market Analytics
What it is
Market Analytics is a set of five dashboards that surface aggregate pricing data across the diamond market. Each dashboard answers a different question: what does the overall market look like, how is a specific segment trending, how do two or more segments compare, how do prices differ between regions, and what is the history of a single certified stone. All five views are accessible from the tab bar at the top of the analytics section. These dashboards run on the same live market data described in the Stone Insights Knowledge Hub introduction — the encyclopedia, lessons, and blog provide the trade context for interpreting the numbers here.
Why you'd use it
- You want a high-level snapshot of the market — total stones, average price, shape distribution — before drilling into specific segments.
- You track a particular bucket over weeks and need to see whether prices are trending up, down, or holding flat.
- You manage multiple buckets and want to compare median prices, liquidity, and volatility side-by-side to decide where margins look best.
- You sell into two or more regions and need to quantify price differences for the same segment across geographies.
- You have a GIA, IGI, or HRD certificate number and want to look up its price history and current market position.
Step-by-step
Browse the Overview
- Open the sidebar and go to Analytics (or visit
/app/analytics). The Overview tab is selected by default. - Use the filter bar to narrow the data. Set Diamond Type, Region, Shape, Carat Min, and Carat Max as needed. Leave a filter blank to include all values.
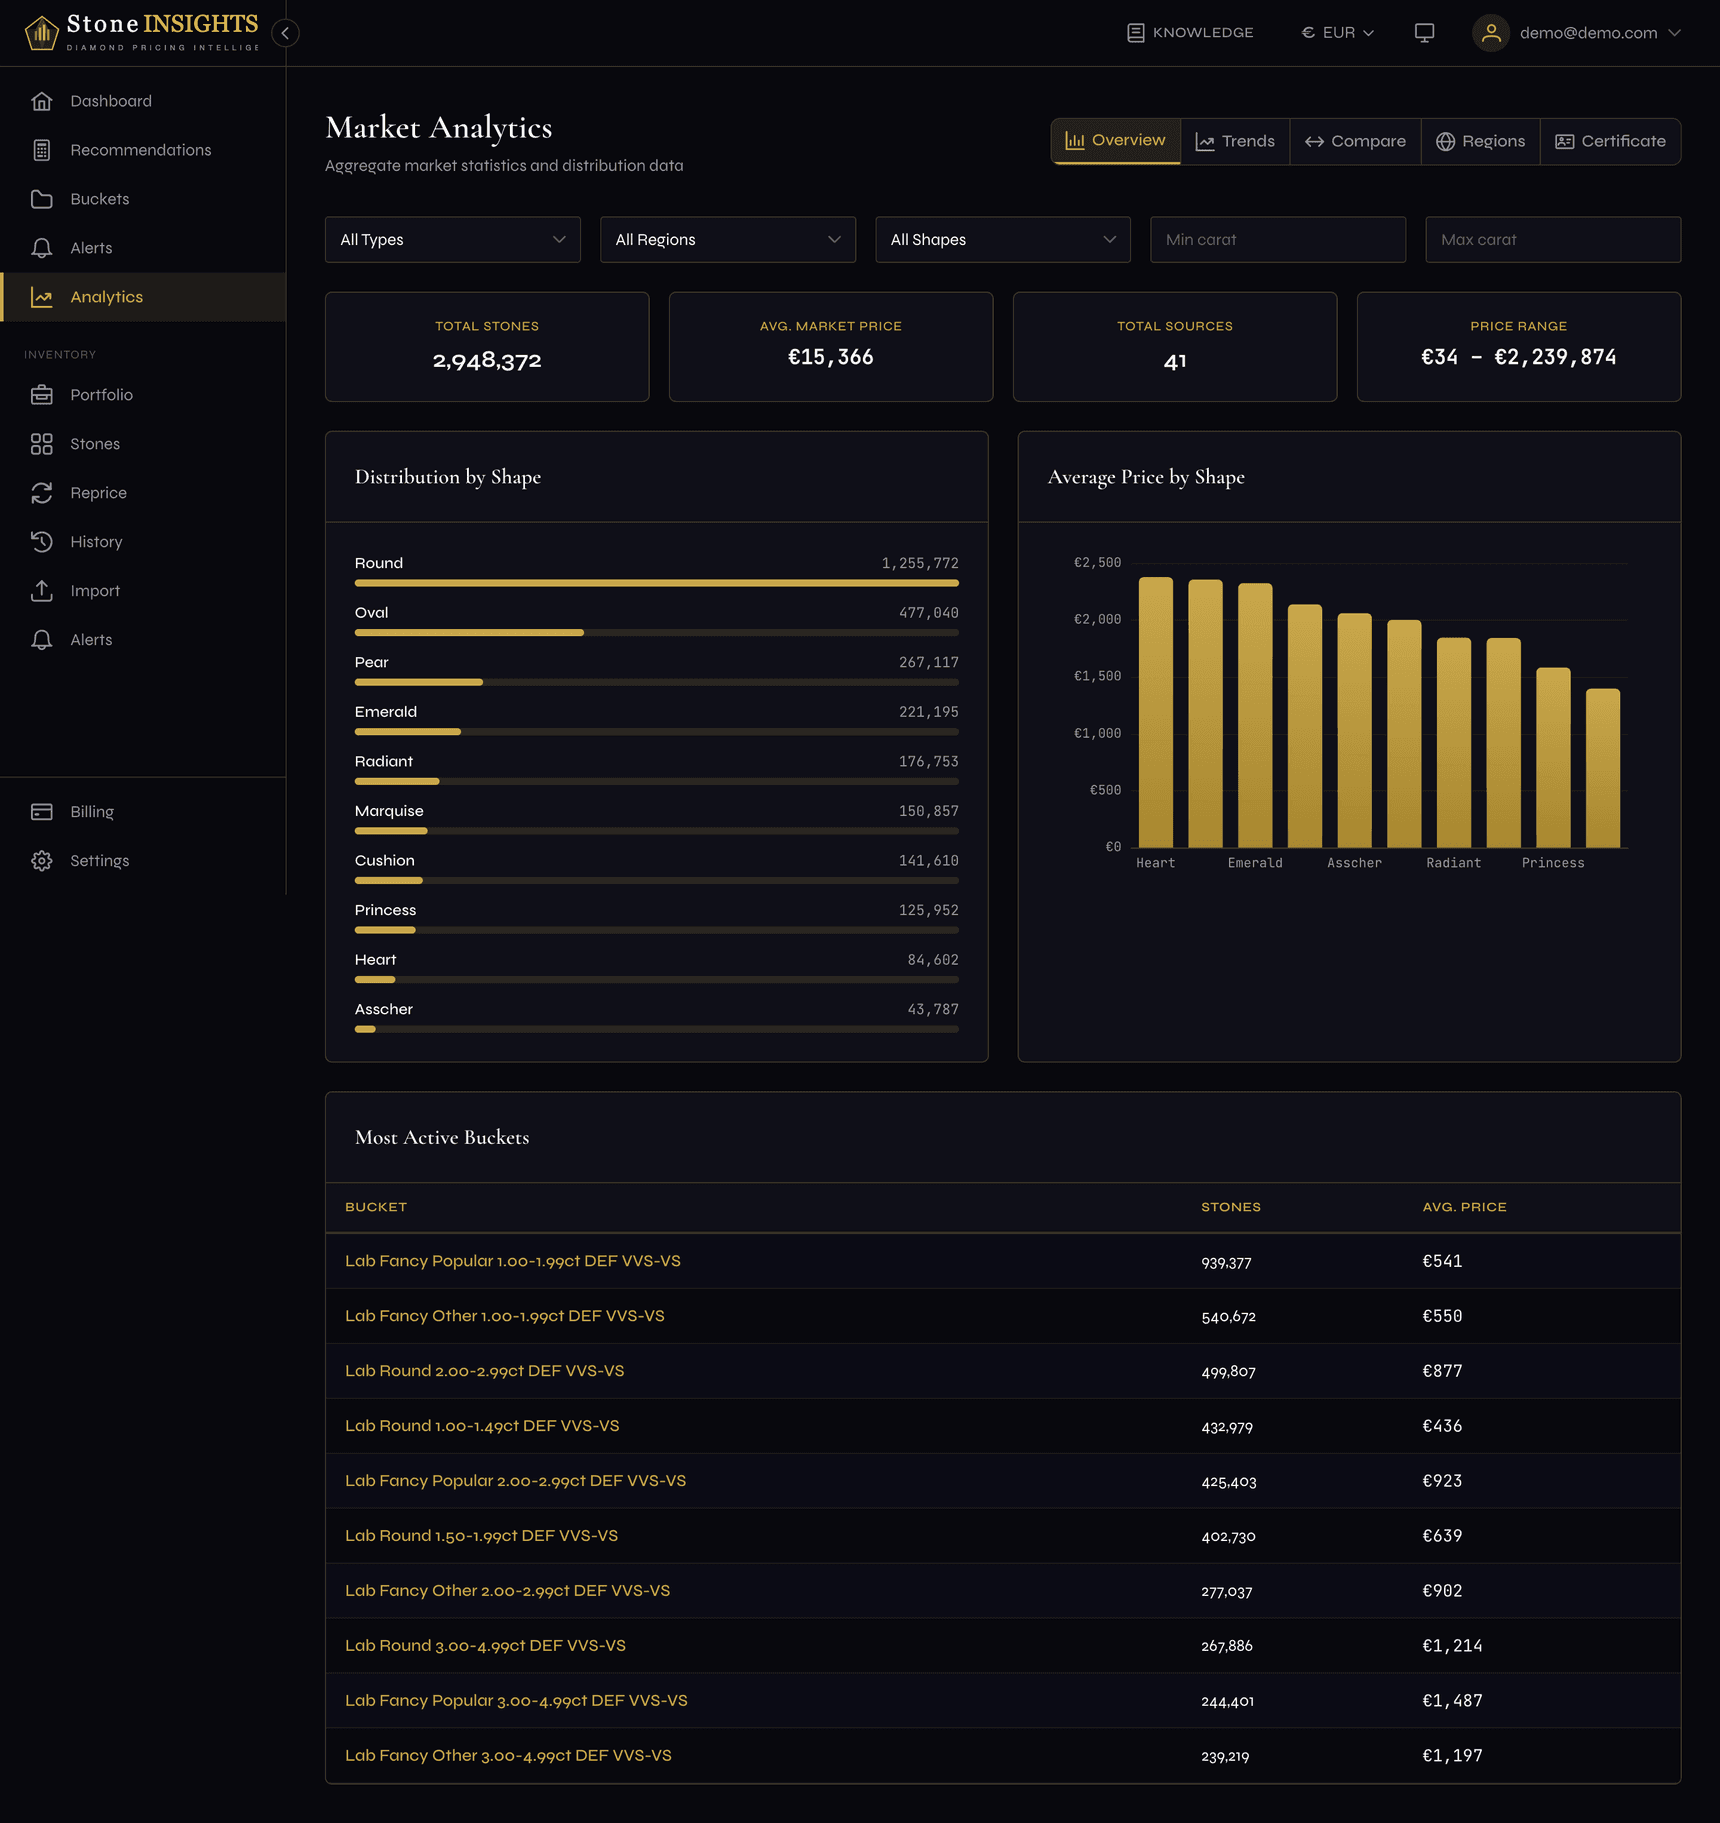
- Read the summary cards at the top: Total Stones, Avg. Market Price, Total Sources, and Price Range. These reflect the filtered market.
- Below the cards, two charts appear side-by-side. Distribution by Shape shows stone counts as horizontal bars. Average Price by Shape shows a vertical bar chart ranked from highest to lowest average price.
- Scroll down to the Most Active Buckets table. It lists your buckets sorted by stone count, with average price for each.
Analyze Trends
- Click the Trends tab in the tab bar at the top.
- Select a Bucket from the dropdown. The list shows both your custom buckets and system buckets.
- Choose a Period — 7 Days, 30 Days, or 90 Days.
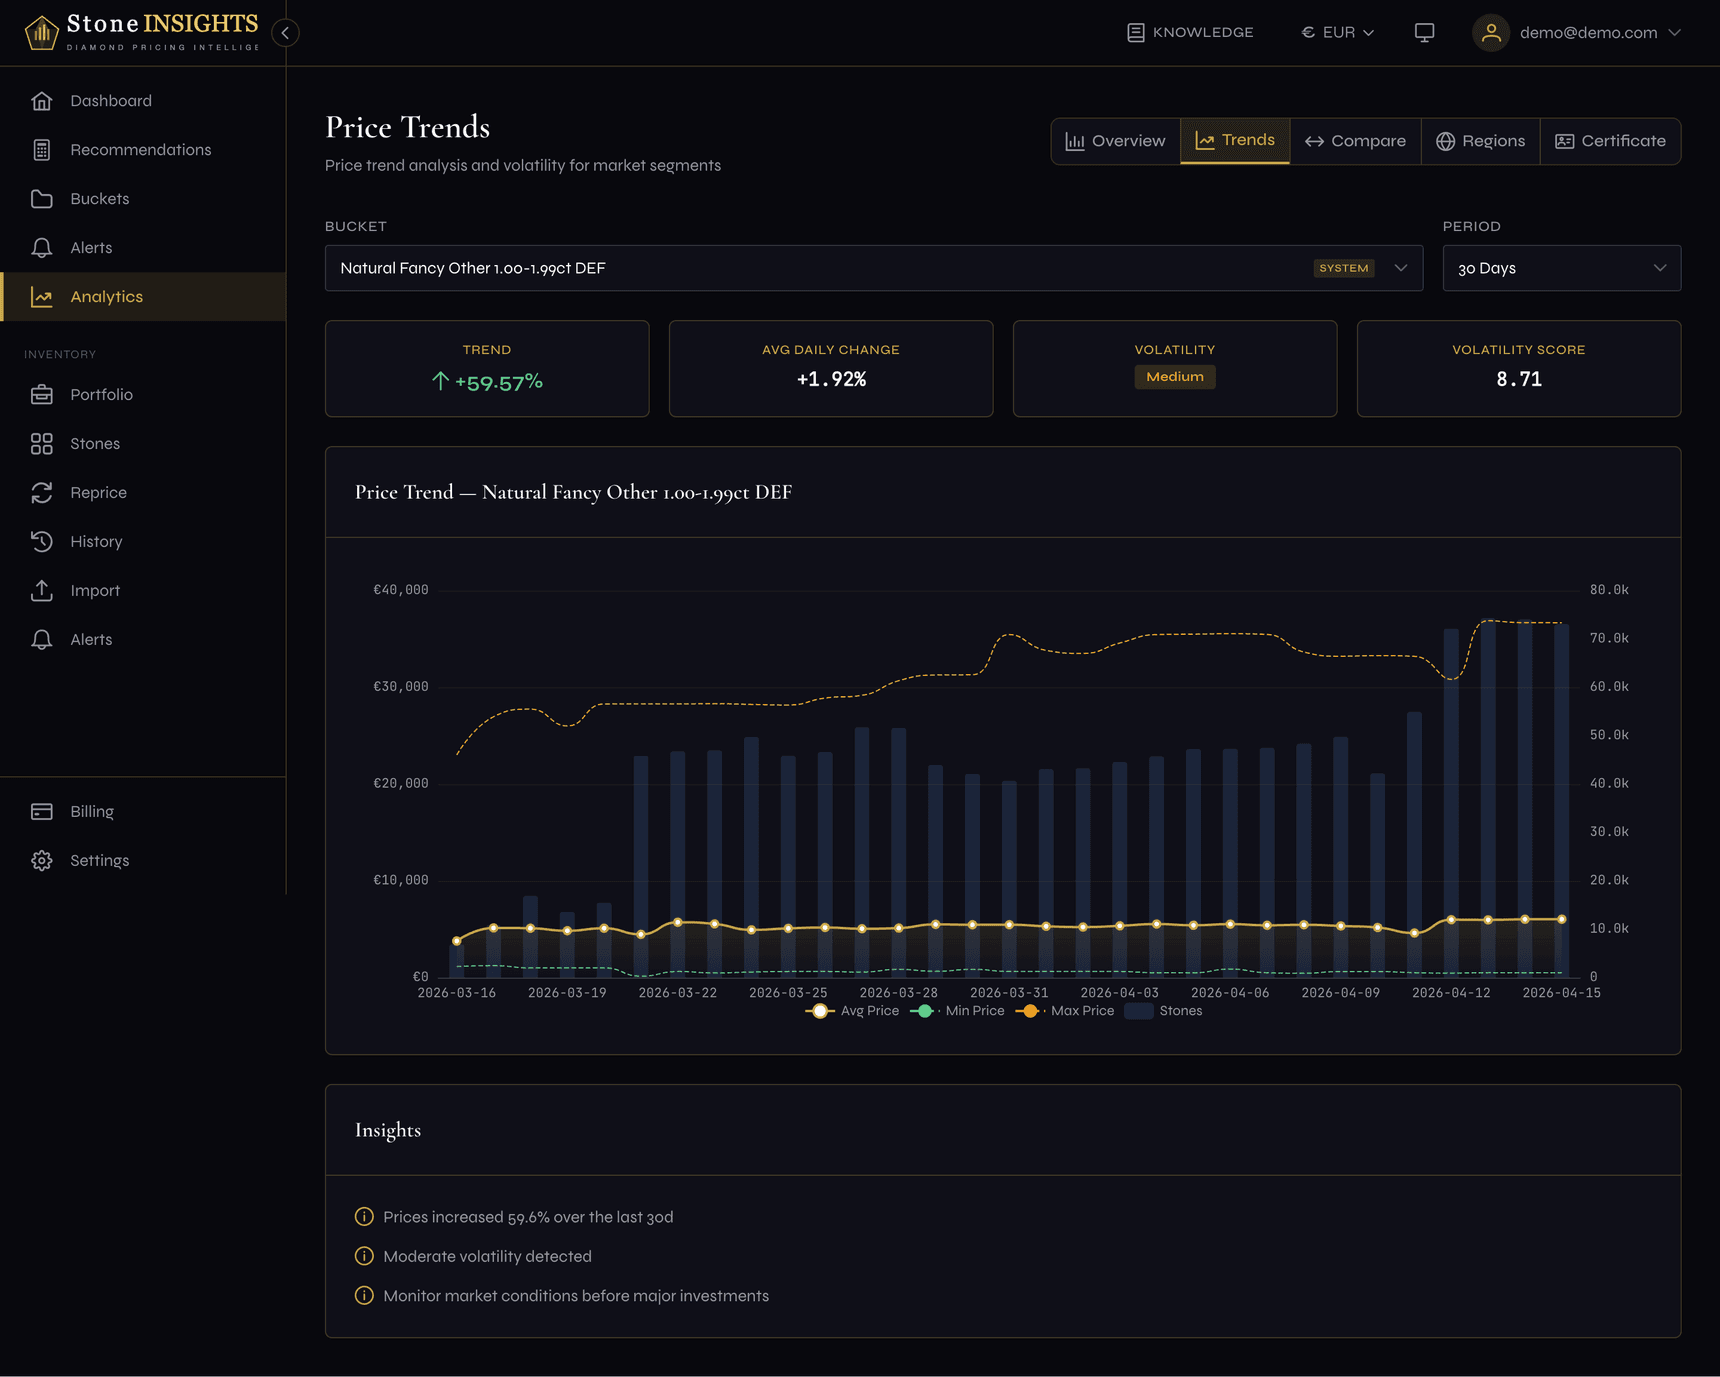
- Read the metric cards: Trend (direction and percentage change), Avg Daily Change, Volatility (low, medium, or high badge), and Volatility Score (numerical measure).
- Study the price chart below. The gold line is the average price, dashed lines show min and max, and the faint blue bars represent stone count per day. Hover over any point for exact values.
- If the platform detected patterns, an Insights card appears beneath the chart with plain-language observations about the data.
Compare Buckets
- Click the Compare tab.
- Search or scroll the bucket list and click buckets to select them. You need at least 2 and can select up to 10. Selected buckets appear as chips above the list.
- Click Compare Buckets.
- Four highlight cards appear: Highest Price, Lowest Price, Best Trend, and Most Liquid (highest stone count).
- Below the highlights, a P50 Price Comparison bar chart shows the median price for each selected bucket.
- The Detailed Comparison table lists each bucket with its P50 price, stone count, 7-day trend, and volatility level.
- An Insights card may appear with cross-bucket observations.
Compare Regions
- Click the Regions tab.
- Select Region A and Region B from the dropdowns. The two regions must be different.
- Select a Bucket — only system buckets are available here.
- Choose a Period (7 Days, 30 Days, or 90 Days).
- Click Compare Regions.
- Four highlight cards summarize the comparison: Price Difference (percentage gap), Deeper Market (which region has more stones), Volatility (which region is more volatile), and Confidence (which region has a higher confidence score).
- The Price Trends chart overlays median price lines for both regions over the selected period.
- The Price Distribution section shows range bars for market and supplier prices in each region. The colored fill represents the P25–P75 range, and the vertical marker is the median.
- The Detailed Comparison table breaks down every metric — medians, percentiles, min/max, standard deviation, supplier prices, margin potential, stone count, source count, confidence, and period trend — with the difference calculated for each row.
Look Up a Certificate
- Click the Certificate tab.
- Enter a GIA, IGI, or HRD certificate number in the search bar and press Enter or click Search.
- The characteristics grid shows the stone's grading details: lab, type, shape, carat, color, clarity, cut, polish, symmetry, fluorescence, depth, and table.
- Metric cards below show Last Price, Price Trend (rising, falling, or stable), Price Range, and Average Price.
- The Price History chart plots the stone's price over time.
- The Market Prices table lists the most recent price observations with collection dates.
Understanding the result
Trend direction appears as an arrow with a percentage. A green up-arrow means prices rose over the period; a red down-arrow means they fell. A flat dash means minimal movement.
Volatility is rated Low, Medium, or High. Low means prices stayed within a narrow band. High means significant swings — useful to know before committing to a price. The numerical volatility score provides a finer-grained measure (0 is perfectly stable; higher values indicate more instability).
Insights are plain-language summaries generated from the data. They call out notable patterns — for example, a segment losing liquidity or one region consistently pricing higher than another.
Price distribution bars on the Regions tab show the P25–P75 range as a colored fill and the median as a vertical line. Wider bars mean a wider price spread in that region.
Confidence score reflects how much data the platform had to calculate statistics. Higher scores mean more data points and more reliable numbers.
Field reference
Diamond Type (optional, Overview only) Filter by Natural or Lab-Grown. Leave blank to include both.
Region (optional, Overview only) Filter by geographic market: GB, EU, DE, US, AU, or BG. Leave blank for all regions.
Shape (optional, Overview only) Filter by diamond shape. Leave blank for all shapes.
Carat Min / Carat Max (optional, Overview only) Set a carat range to narrow the overview data. Leave blank for all sizes.
Bucket (required, Trends / Compare / Regions) The bucket whose data to analyze. On the Trends tab, select one bucket. On the Compare tab, select 2–10 buckets. On the Regions tab, only system buckets are available.
Period (required, Trends / Regions) The lookback window: 7 Days, 30 Days, or 90 Days.
Region A / Region B (required, Regions) The two geographic markets to compare. Must be different from each other.
Certificate number (required, Certificate) A GIA, IGI, or HRD certificate ID. Letters, numbers, and hyphens only.
Tips and common mistakes
The Regions tab is scoped to system buckets because region comparison requires standardized segment definitions that are consistent across geographies.
Certificate Lookup supports deep linking. The certificate number is stored in the URL as a query parameter (?id=...), so you can bookmark or share the link and the search runs automatically when the page loads.